
The digital divide in Nigeria is not one gap but five that overlap and reinforce each other: a rural-urban access gap, an infrastructure gap that concentrates fibre in a handful of cities, a gender gap in mobile internet use, an affordability gap between data prices and household income, and a device and literacy gap among people who already have signal.
Rural communities have internet access at a rate of 23%, against 57% in urban areas, a 34-point gap the Nigerian Communications Commission (NCC) disclosed in October 2025.
About 27.91 million Nigerians live in communities with no meaningful telecom access at all.
Treating the divide as five separate but connected problems, rather than one generic story, explains why national broadband statistics can improve while millions of households see no change.
What the Digital Divide in Nigeria Looks Like
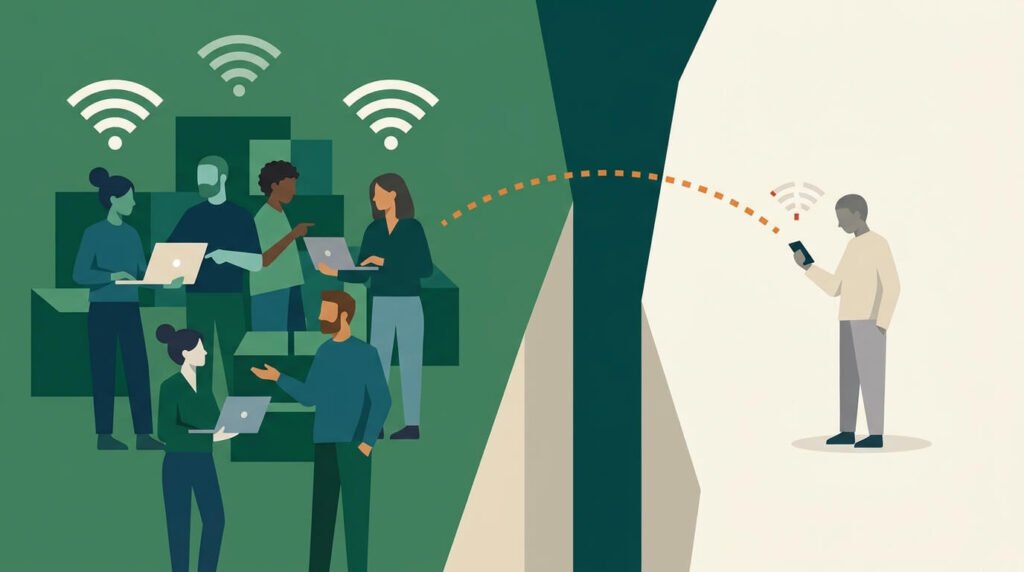
The digital divide in Nigeria describes the combined effect of five distinct gaps that keep large parts of the country offline or under-connected even as national numbers rise: where people live, how infrastructure is distributed, gender, income relative to data cost, and access to a capable device plus the skills to use it.
A state with reasonable fibre coverage on paper can still have millions of women and low-income residents shut out of the same network, which is why a single “urban versus rural” framing understates the problem.
| Gap | Key figure | Source |
|---|---|---|
| Rural-urban access | 23% rural vs 57% urban internet access | NCC, October 2025 |
| Infrastructure concentration | 101,000 km of fibre backbone but only about 265,000 homes on FTTH | Businessday investigation, 2026 |
| Gender | Around 26% mobile internet gender gap across Sub-Saharan Africa | GSMA |
| Affordability | Around 5.8% of average monthly income for 1GB across Sub-Saharan Africa vs a 2% UN target | UN Broadband Commission / regional data |
| Device and literacy | About 66.4% smartphone penetration on MTN’s network as of H1 2026 | MTN |
Each row is a separate policy problem with its own fix. Laying more fibre addresses the infrastructure row but not the gender or affordability rows.
That is the core reason Nigeria’s broadband penetration figures can rise year over year while specific streets and households remain functionally offline.
The Rural-Urban Internet Gap
The rural-urban internet gap in Nigeria stands at 34 percentage points: 23% access in rural areas against 57% in urban ones, a figure NCC Executive Vice Chairman Dr. Aminu Maida disclosed at the Rural Connectivity Summit in Lagos on October 22, 2025.
Maida described a community without digital connectivity as “functionally invisible, cut off from modern education, healthcare, markets, and opportunity.”
A 2022 study identified 97 unserved and underserved community clusters across Nigeria. That number has fallen over time, down from 207 clusters in 2013 and 114 in 2019, but the clusters that remain are the hardest and most expensive to reach.
Together they represent about 27.91 million people with no meaningful telecom access at all.
Closing that remaining gap is estimated to cost roughly $461 million, funded partly through the Universal Service Provision Fund (USPF), which draws on mandatory contributions from licensed telecom operators.
Read the rural-urban access gap in detail for a full breakdown of which regions and community types are most affected.
The Infrastructure Concentration Gap: Fibre Backbone versus Homes Connected
Nigeria’s infrastructure concentration gap is the mismatch between a large national fibre network and a small number of homes connected to it.
The country has built roughly 101,000 kilometers of fibre-optic backbone, a number regulators and operators cite as a national achievement.
A BusinessDay investigation, however, described this backbone as bypassing 130 million Nigerians, since only about 265,000 homes nationally are connected via Fibre-to-the-Home (FTTH) as of 2026.
Even where fibre-to-the-home expansion is happening, it concentrates heavily in a few cities.
MTN’s fixed fibre product, MTN FibreX, is live in 15 states and 232 locations, but 77.6% of those locations sit in just Lagos, Rivers State, and the FCT (Abuja) alone.
The rest of the country, across the other 12 states with any coverage at all, shares less than a quarter of the deployment.
This is the clearest illustration of why national infrastructure totals and local reality diverge: a country can post a large backbone number while the actual last-mile connection remains concentrated in three states.
See how fibre rollout favors a handful of cities for the state-by-state detail.
The Gender Digital Divide
Nigeria’s gender digital divide sits within a wider Sub-Saharan African pattern in which GSMA data show a mobile internet gender gap of around 26%, meaning women across the region are meaningfully less likely than men to use mobile internet.
GSMA has separately named Nigeria among the countries with the widest mobile internet gender gaps, without publishing a single confirmed Nigeria-only percentage to sit alongside the regional figure.
Globally, GSMA figures show women are about 12% less likely than men to use mobile internet, and roughly 210 million fewer women than men own smartphones across low- and middle-income countries.
According to NITDA Director-General Kashifu Inuwa Abdullahi, bridging Nigeria’s gender digital divide could add an estimated $13 billion to GDP over the next decade, a figure drawn from a World Wide Web Foundation report that frames the gap as an economic cost, not only a social one.
National and regional statistics like the ones above describe the divide in aggregate, but they cannot show which specific streets or neighborhoods within a city are being left behind. Arandmi lets residents rate real internet and power reliability area by area, turning the abstract national picture into a concrete, street-level one.
The Affordability Gap: Why cheap data still costs too much
Nigeria’s affordability gap exists because a data price that looks low in raw US-dollar terms internationally can still represent a heavy relative burden for lower-income households, and cost relative to income matters more than the sticker price alone.
The Sub-Saharan Africa regional average cost of 1GB of data sits around 5.8% of average monthly income, well above the UN Broadband Commission’s “1 for 2” affordability target of 2% of monthly income.
That regional pressure got sharper in Nigeria specifically after the NCC approved a 50% tariff increase in January 2025, raising the regulated 1GB benchmark price from N287.50 to N431.25.
Total data usage kept climbing nationally after the increase, which shows demand from higher-income and business users held up, but the increase widened the affordability pressure specifically for lower-income users who were already spending a larger share of their income on connectivity.
Read more on the 2025 price increase and what it changed for different income groups.
The Device and Digital Literacy Gap
Nigeria’s device and literacy gap means that having network coverage is not the same as having the means or the skill to use it.
Smartphone penetration on MTN’s own network reached about 66.4% as of H1 2026, meaning roughly a third of even one major operator’s subscriber base was not yet on a smartphone capable of full internet use.
A feature phone can make calls and send texts, but it cannot run most banking apps, video calls, or the web services that define “internet access” in national statistics.
Academic research comparing rural digital literacy and access in China and Nigeria, published in Humanities and Social Sciences Communications, has flagged digital literacy itself, separate from connectivity, as a compounding barrier in rural Nigerian communities.
Having a signal and a device is not the same as knowing how to use digital services effectively for banking, health information, or job searches.
This is why device-cost interventions and network expansion alone do not close the full gap; digital skills training has to be part of the same effort.
How Nigeria is trying to close the digital divide
Nigeria’s policy response to the digital divide runs through three main channels: NITDA, the Universal Service Provision Fund, and NCC’s broadband targets.
NITDA administers the National Digital Economy Policy and Strategy (NDEPS), which sets the government’s overall digital inclusion direction.
The USPF, financed by mandatory contributions from licensed telecom operators, funds infrastructure projects in the unserved and underserved clusters identified in the 2022 study.
On the connectivity target itself, NCC’s National Broadband Plan (2020-2025) aimed for 70% broadband penetration by the end of 2025.
Actual penetration reached only about 48.81% to 50.58% through late 2025, before climbing to 56.79% by June 2026.
That trajectory shows steady progress but also a clear miss of the original target, and it is consistent with the pattern seen throughout this article: national averages improve gradually while specific gaps, like the three states holding 77.6% of MTN FibreX locations, remain largely unchanged.
Why the Five Gaps Compound Each Other
The five gaps in Nigeria’s digital divide are not independent problems that can be solved one at a time; they stack on top of each other for the people who fall into more than one category.
A woman in a rural, low-income household can face the rural-access gap, the affordability gap, and the gender gap at the same time, which means fixing any single one of them barely moves her actual ability to get online.
This is also why aggregate national numbers can look encouraging while the most excluded households see no real change.
Broadband penetration climbing from around 50% to 56.79% nationally is genuine progress, but it says nothing about whether that growth reached the 97 unserved and underserved clusters, or whether it reached women at the same rate it reached men.
A household that is poor, rural, and headed by a woman with a feature phone sits at the intersection of every gap in the summary table above, and national statistics, by design, average that household’s experience together with millions of others who face none of those barriers.
Statistics like these describe the divide at a national and regional scale, but they cannot tell a house hunter whether a specific street has usable internet and stable power, which is a different question from the national connectivity picture painted by NCC and GSMA data.
Answering that narrower, street-level question takes local, resident-reported information rather than another national survey.
Frequently Asked Questions
What causes the digital divide in Nigeria?
The causes are structural rather than a single failure: telecom infrastructure investment has concentrated in Lagos, Rivers State, and the FCT (77.6% of MTN FibreX locations sit in those three areas alone), while 97 unserved and underserved community clusters remain expensive and commercially unattractive to reach.
On top of that, data affordability relative to income, a mobile internet gender gap flagged by GSMA as among the widest globally for Nigeria, and low smartphone penetration (about 66.4% even on MTN’s network as of H1 2026) all add separate barriers on top of physical coverage.
How wide is the gender digital divide in Nigeria?
Nigeria does not have a single confirmed Nigeria-only gender-gap percentage from the sources available, but it sits within a Sub-Saharan African region where GSMA reports a mobile internet gender gap of around 26%, and GSMA has separately named Nigeria among the countries with the widest such gaps worldwide.
Globally, GSMA data show women are about 12% less likely than men to use mobile internet, with roughly 210 million fewer women than men owning smartphones across low- and middle-income countries.
NITDA’s Director-General has said closing this gap could add an estimated $13 billion to Nigeria’s GDP.
What is Nigeria doing to close the digital divide?
Nigeria’s response runs through NITDA’s National Digital Economy Policy and Strategy, the Universal Service Provision Fund, which is financed by mandatory contributions from licensed telecom operators and targets the 97 unserved and underserved community clusters, and NCC’s National Broadband Plan.
That plan targeted 70% broadband penetration by the end of 2025 but reached only about 48.81% to 50.58% through late 2025, climbing to 56.79% by June 2026, showing real but incomplete progress against the original goal.