
Nigeria’s internet penetration rate depends on which measurement you mean. By unique users, 45.5% of the population, or 109 million people, were online as of October 2025, according to DataReportal’s “Digital 2026: Nigeria” report.
By broadband subscriptions, the Nigerian Communications Commission (NCC) recorded 56.79% penetration in June 2026, based on 123.11 million active broadband lines. Both figures are accurate.
They measure different things, and the gap between them is the reason so many reports on Nigeria’s internet access seem to contradict each other.
What is Nigeria’s current internet penetration rate?
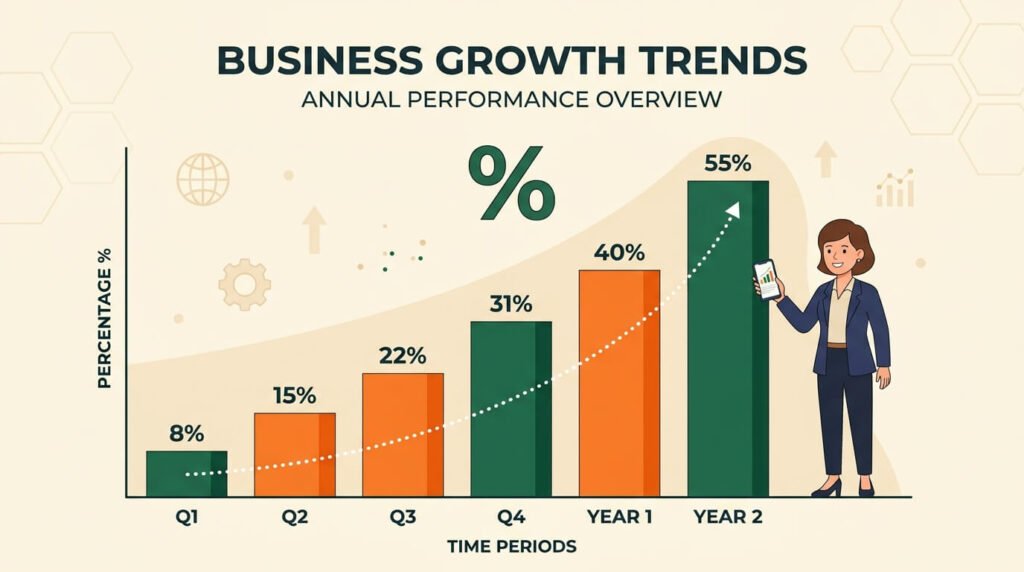
Nigeria has two current, valid penetration figures, not one. The unique-user figure sits at 45.5% (109 million people) as of October 2025, up 2.5 million users, or 2.3%, from October 2024, per DataReportal.
The broadband subscription figure sits at 56.79% (123.11 million subscriptions) as of June 2026, up from 56.11% (121.64 million subscriptions) the month before, per NCC data.
For anyone researching internet in Nigeria before relocating or investing, the practical takeaway is that neither number alone tells the full story: one counts people, the other counts active lines, and Nigeria’s SIM ownership habits keep those two counts from matching.
Total active telecom subscriptions across all networks reached 192.23 million by June 2026, up from 189.68 million in May, giving Nigeria a teledensity of 88.67%.
Teledensity counts every active line, voice and data combined, against population, so it sits even higher than either penetration figure.
None of these three numbers- unique users, broadband subscriptions, or teledensity- should be quoted interchangeably. Each answers a different question.
Why are there two different internet penetration numbers for Nigeria?
The two figures diverge because they count different units. DataReportal’s 45.5% counts individual human beings who used the internet at least once in the reporting period.
The NCC’s 56.79% counts active broadband subscriptions, meaning SIM cards or lines registered for data service.
A single Nigerian internet user can hold more than one active broadband line at once, and when that happens, one person shows up as two or three subscriptions in the NCC count while remaining one person in the DataReportal count.
How multi-SIM ownership inflates the subscription figure
Multi-SIM ownership is common in Nigeria for practical reasons rather than any single cause.
Many users keep a line on MTN and a second on Airtel or Glo because network quality varies by location, and switching lines avoids downtime during outages on one carrier.
Others keep separate lines to take advantage of data promotions that only apply to new or specific SIMs, or to split personal and business use across two numbers.
Each of these habits adds a subscription to the NCC’s count without adding a new person to the population of internet users.
With 192.23 million active telecom subscriptions against a population of roughly 239 million, the arithmetic implies substantial SIM duplication, since the unique-user figure of 109 million is far below the subscription count.
Which figure should you use?
The right figure depends on what you are trying to measure. If the question is how many Nigerians can get online, the DataReportal unique-user figure (45.5%, 109 million people) is the more accurate answer.
If the question is how active the broadband market is, or how the NCC is tracking against its own regulatory targets, the broadband subscription figure (56.79%) is the correct reference, because that is the metric the NCC itself uses to judge progress toward its stated policy goals.
Citing the subscription figure as a count of “internet users” overstates how many people are connected, since it double-counts everyone with more than one active data line.
If you are thinking in terms of market size reach for the NCC number, or if you are thinking in terms of digital inclusion or the share of the population left offline, then you should refer to the DataReportal number.
How has Nigeria’s internet penetration grown, and did it hit its 70% target?
Nigeria’s broadband penetration rose from 48.01% in July 2025 to 56.79% by June 2026, but it fell well short of the 70% target the National Broadband Plan (2020-2025) set for the end of 2025.
The plan’s target date has already passed, and as of this research, the NCC had not published a confirmed successor plan, though it continues to treat 70% penetration as its primary objective.
| Period | Broadband penetration | Subscriptions |
|---|---|---|
| July 2025 | 48.01% | approx. 104 million |
| October 2025 (NCC EVC statement) | approx. 48.81% | not separately disclosed |
| November 2025 (reported) | approx. 50.58% | not separately disclosed |
| May 2026 | 56.11% | 121,643,718 |
| June 2026 | 56.79% | 123,110,000 |
| National Broadband Plan target (end of 2025) | 70.00% | not met |
The table shows real, sustained growth, roughly nine percentage points in eleven months, but also a persistent shortfall against the target set six years earlier.
Tracking the number of broadband subscribers in Nigeria month to month is a more reliable way to judge momentum than comparing any single snapshot to the 70% goal, since the subscriber count moves in a fairly steady upward line even while the target itself remains unmet.
The economic stakes attached to this gap are not abstract. A commonly cited estimate holds that every 10-percentage-point increase in broadband penetration can lift GDP by up to 1.38%.
Applied to Nigeria’s shortfall, closing even half the distance between the current 56.79% and the 70% target would represent a measurable economic gain, which is part of why the NCC continues to treat the target as unfinished business rather than a plan to be quietly dropped.
A national average, whichever version of the penetration rate you use, is a single number that hides enormous variation between one street and the next.
Arandmi lets residents rate real internet and power reliability area by area, so you can check the actual picture for a specific address instead of relying on a country-wide statistic.
What’s holding Nigeria’s internet penetration back?
Nigeria’s penetration rate is growing slower than the National Broadband Plan intended because of a combination of infrastructure damage, cost barriers, and uneven access between rural and urban areas.
The most direct evidence of the access gap came from NCC Executive Vice Chairman Dr. Aminu Maida, who disclosed at the Rural Connectivity Summit in Lagos on October 22, 2025, that rural communities have only 23% internet access compared to 57% in urban areas, a 34-percentage-point gap that drags the national average down regardless of how fast urban connectivity grows.
- Fiber cuts disrupted service more than 19,000 times between January and August 2025, often from road construction or unrelated excavation work that severs buried cables.
- Equipment theft and vandalism at telecom sites were reported more than 3,000 times over the same period, forcing operators to repair or replace infrastructure instead of expanding it.
- High Right-of-Way (RoW) fees in many states raise the cost of laying new fiber, though 11 states have now dropped RoW charges to zero to encourage faster rollout.
- High energy costs for running base stations, especially in areas without reliable grid power, push up operating costs and slow network expansion into lower-revenue areas.
- Limited last-mile infrastructure in rural areas means many communities have no nearby fiber or tower to connect to at all, which is the direct cause of the 23% rural access figure.
Network technology also shapes how much of the population experiences “internet access” in a meaningful sense.
As of the current data, 4G connections make up 54.31% of Nigeria’s mobile network mix, 2G makes up 36.22%, 3G is 4.86%, and 5G is 4.61%.
A 2G-only connection barely supports modern internet use, so a meaningful share of Nigeria’s teledensity reflects voice-capable lines rather than genuine broadband access.
Upgrading a household or a community from 2G to 4G, without adding a single new subscriber to the national count, can turn a nominal connection into one that supports video calls, mobile banking, and remote work.
Anyone comparing neighborhoods should look closely at rural internet access in Nigeria, since the national penetration figures blend together areas with strong 4G coverage and areas still running mostly on 2G.
How does market share break down among Nigeria’s network operators?
MTN Nigeria holds the largest share of the country’s telecom subscriptions, followed by Airtel, Globacom, and 9mobile, and this distribution matters because network choice affects the practical internet experience a household gets in a given area.
As of June 2026, the market split was as follows.
| Operator | Subscriptions (millions) | Market share |
|---|---|---|
| MTN Nigeria | 98.64 | 51.38% |
| Airtel | 66.12 | 34.44% |
| Globacom | 23.68 | 12.34% |
| 9mobile | 3.54 | 1.84% |
MTN’s dominant share means its network coverage and pricing decisions have an outsized effect on the national penetration figures, but coverage quality still varies by state and by neighborhood regardless of which operator leads nationally.
A household in an area with weak MTN coverage may get a far better connection on Airtel or Glo, which is one more reason a single national percentage cannot tell a house hunter what to expect at a specific address.
Before treating any of these figures as a guarantee of local service quality, it helps to compare the national trend against ground-level reports from the neighborhoods you are considering, since operator strength and infrastructure investment are not distributed evenly across Nigeria’s states and cities.
A house hunter comparing two properties in the same city can find that one address gets a strong signal from every major operator while the other gets a reliable connection from only one, and national market share figures give no indication of which situation applies to a specific street.
One Response